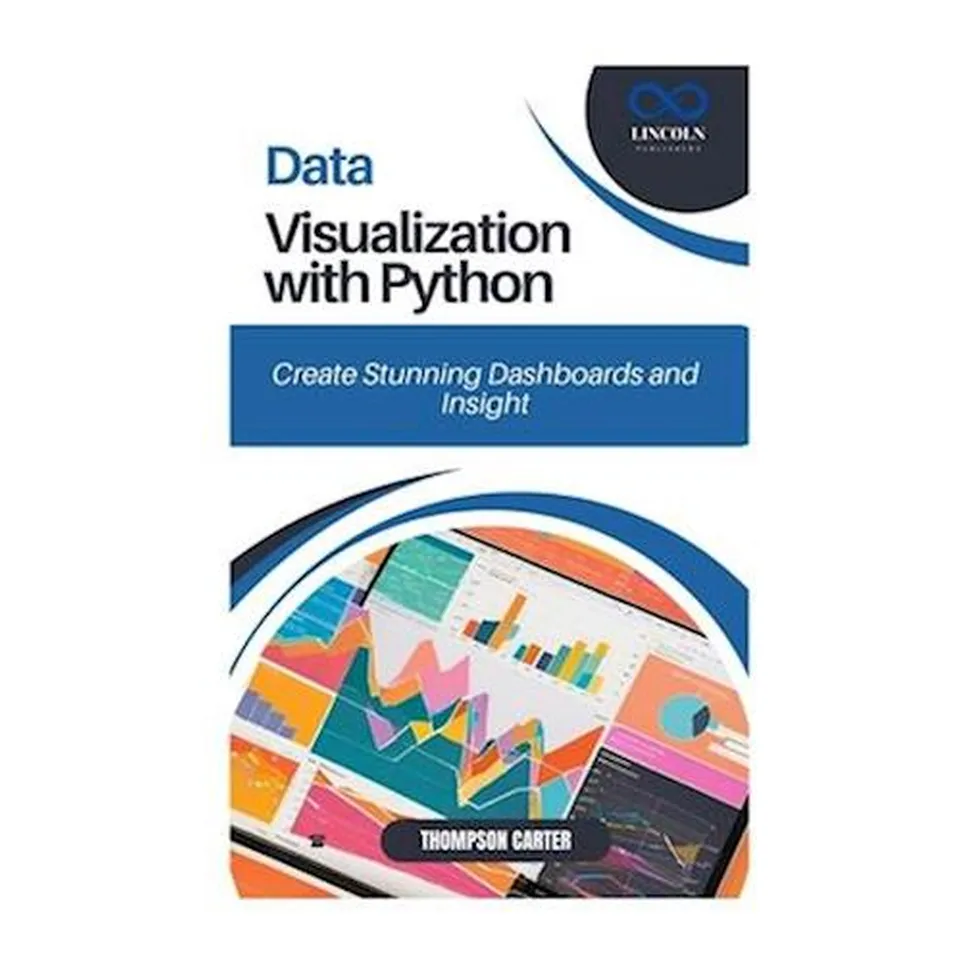
Data Visualization with Python
186,96kr.
Hos Saxo
Gå til SaxoReklame: vi får provision, hvis du køber hos butikken.
- Priser hentet i dag kl. 03.21
- Du køber direkte hos butikken
- Vi sammenligner 98 butikker
Om varen
Data Visualization with Python: Create Stunning Dashboards and Insights Unlock the full potential of your data with Data Visualization with Python, the ultimate guide to transforming raw data into compelling, interactive dashboards and insightful visualizations. Designed for data analysts, scientists, and Python developers, this book provides step-by-step instructions on how to build visually appealing and meaningful visualizations using Python libraries like Matplotlib, Seaborn, and Plotly. Whether you're analyzing trends, making data-driven decisions, or presenting insights to stakeholders, this book will help you design stunning visuals that convey complex information clearly.
Beskrivelse fra Saxo
- Mærke
- Thompson Carter
- Genre
- Fagbog
- Forfatter
- Thompson Carter
- Sprog
- Dansk
- Varenummer
- 9798310033054
- EAN
- 9798310033054
Flere varer fra Thompson Carter
Se alle-

Cloud Computing Basics: Understanding AWS, Azure, and Google Cloud
186,96kr.
-

MASTERING THE LINUX COMMAND LINE: Essential Commands and Tips for Beginners
182,71kr.
-

PYTHON PROJECTS FOR BEGINNERS: Fun and Easy Projects to Master Python
186,96kr.
-

BUILD YOUR OWN WEBSITE: A Beginner's Guide to WordPress and Site Design
182,71kr.
-

PRACTICAL KUBERNETES FOR DEVELOPERS: Containerize, Deploy, and Manage Applications with Kubernetes
186,96kr.
-
Practical Data Science with R and Python
280,46kr.